« Empty Strings in C++ | Home | INT(PI) »
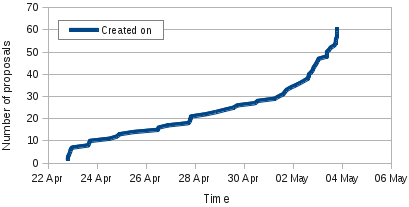
I've produced a graph of the 61 student applications which Debian received for GSoC this year:

Ana blogged a similar graph last year if you want to compare. It looks like the total is down a little (though I'm not sure if the figure of 81 from the text, or ~68 read from the graph is correct for last year) - this is likely at least partly due to the number of proposals each student can send having been reduced from 20 last year to 5 this year, which should have reduced the number of low quality proposals. The timeline this year is later, which may have also had an effect.
If you're an admin or a mentor, you can produce a similar graph for your own org(s) - just download this OpenDocument spreadsheet and follow the instructions inside.
Posted in debian by Olly Betts on 2013-05-06 13:36 | Permalink